How to Measure Event ROI: 7 Easy Steps + Metrics to Track
Whenever you hold an event, you want to make sure that you get back more than you put in—or at least break even! Measuring event ROI is the key to understanding:
- Where you spent money
- Where you made money
- Where to keep investing
- Where to cut
- How to develop strategic event budgets in the future
But which event ROI metrics are most important to track? And how do you calculate your return on investment?
Here’s everything you need to know about event ROI, plus a free event ROI calculator!
What Is Event ROI?
Event ROI is the return on investment you see after running an event. After the time, energy, and money you put into holding the event, measuring your return on investment offers insight into how profitable and stable your event was.
Did you build community? Earn back more than you invested? Bring in new business leads?
Event ROI matters because it gives you clear data. And with data, you can make smarter decisions, run better events, and meet your goals with pinpoint precision—whether those goals are soft (attendee engagement, brand awareness) or hard (dollars made).
What is a good ROI for an event?
Good ROI looks different depending on the goals you set for the event! This could mean earning a certain amount of revenue, getting 20 attendees per a certain amount of marketing dollars, or any other metric that brings you closer to your annual goals.
Before you run your event, you’re going to want to set those goals and create a plan for meeting them. Remember, good ROI just means meeting your goals; great ROI means exceeding them!
If you come out feeling like you wasted money, or didn’t accomplish what you set out to do, that’s bad ROI.
5 Event ROI Metrics You Need to Track
The good news when it comes to measuring event ROI? You’re in control.
The tricky part? Every event and organization is different.
To begin finding metrics for your industry, we recommend:
- Talking with your partners
- Looking at your past results
- Exploring industry-specific research reports
Each of these can help you set key performance indicators (KPIs) that are realistic and measurable.
However, regardless of industry, there are a few crucial metrics your organization could benefit from tracking. Financial revenue and expenses are only one way to measure return on investment!
Keep these event ROI metrics in mind to better measure your success.
Revenue-based ROI metrics
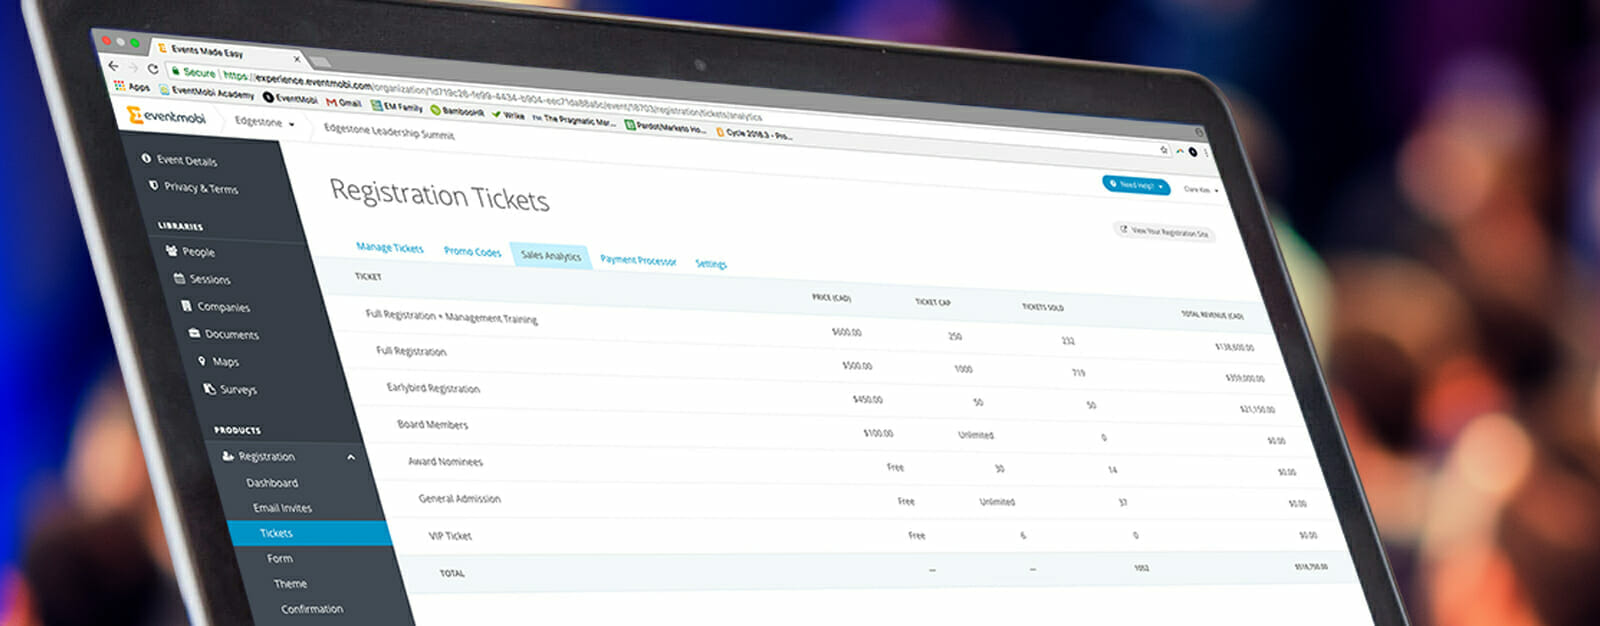
Revenue-based ROI is a key metric for measuring event success. It provides quantifiable results to your event stakeholders like your organization’s executive team, board, and sponsors.
What counts? Everything you’ve sold! For example:
- Total number of tickets sold and their resulting revenue
- Comparing the number of registrants vs. the actual attendance rate
- Exhibition booths sold
- Merch & swag sold
- Raffle tickets sold
And generally any other item or service you’re selling as part of your event. Heck—if you put together a bar and sold the drinks yourself, that counts as revenue too!
Event sponsorship ROI metrics
Sponsorships are a cornerstone of successful events, providing additional financial or in-kind resourcing that means more programming, activities, and connections for your attendees.
So you want them coming back. And that’s where knowing how to measure event sponsorship ROI is crucial.
To create a competitive event sponsorship package, or to bring your sponsors back year after year, give your sponsors event ROI metrics that show how valuable their sponsorship can be!
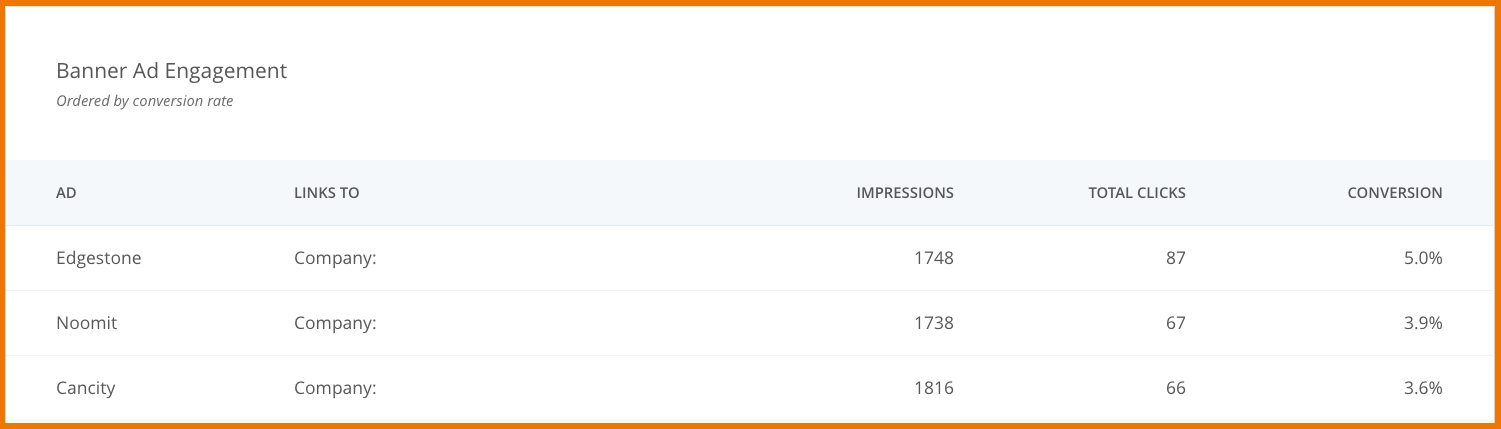
For instance, EventMobi’s event app platform provides tons of built-in analytics for sponsor engagement, like:
- Number of sponsor banner impressions, clicks, and conversion rate
- Company page visits
- Leads acquired
- Views of sponsored content
- Gamification engagement
This highlights the amount of exposure each sponsor received from the event’s audience. It directly translates into the ROI you’re delivering your sponsors, which means they’ll keep giving you the investment to generate your own return.
Event marketing metrics
Chances are, your marketing team puts a lot of time and effort (as well as money!) into making your event as visible as possible.
The easiest way to cut stress and make sure you’re putting your work where the worth is to look at event marketing ROI.
Event marketing metrics are the leading indicators on ROI, and can include:
- Social media conversion rate (eg. likes to registrants, impressions to registrations)
- Email open to registrant rate, or click to registrant rate
- Website conversion rate (eg. visits to registrants)
- Cost per attendee by channel (eg. PPC, Paid Social)
- # of new registrants
- # of return registrants
Some leading indicators include:
- Social likes and shares
- Social followers
- Event hashtag mentions
- Website visits
- Email opens and clicks
A leading indicator is a metric that matters, but doesn’t directly tie back to return on investment. ROI for marketing should ultimately be about getting back any $$$ spent on generating registrations. But a leading indicator could show potential, even if the return isn’t there yet.
For example, if you send out an email that has high clicks, but low registrations? Try playing with the CTA in the email, or A/B test the layout or information on the registration landing page. That way, you can make more from a promising channel!
Event marketing shouldn’t just feel like shouting into the void—there are plenty of metrics you can use to measure how successful your team was. And if you find any efforts didn’t pay off, you can see exactly what to adjust for next time.
How to measure virtual event ROI
Measuring ROI for virtual events is not so different from in-person events!
But when it comes to your important engagement metrics, it’s actually much easier. You can’t track how every in-person conversation played out, but you can measure how many attendees used the chat feature.
Tracking your virtual conference engagement is a great way to get an idea of your ROI, because it tells you how engaged your attendees are. The more engaged the attendee, the more likely they are to attend future events!
Or, for our member-based organizations: the more likely they are to renew their membership.
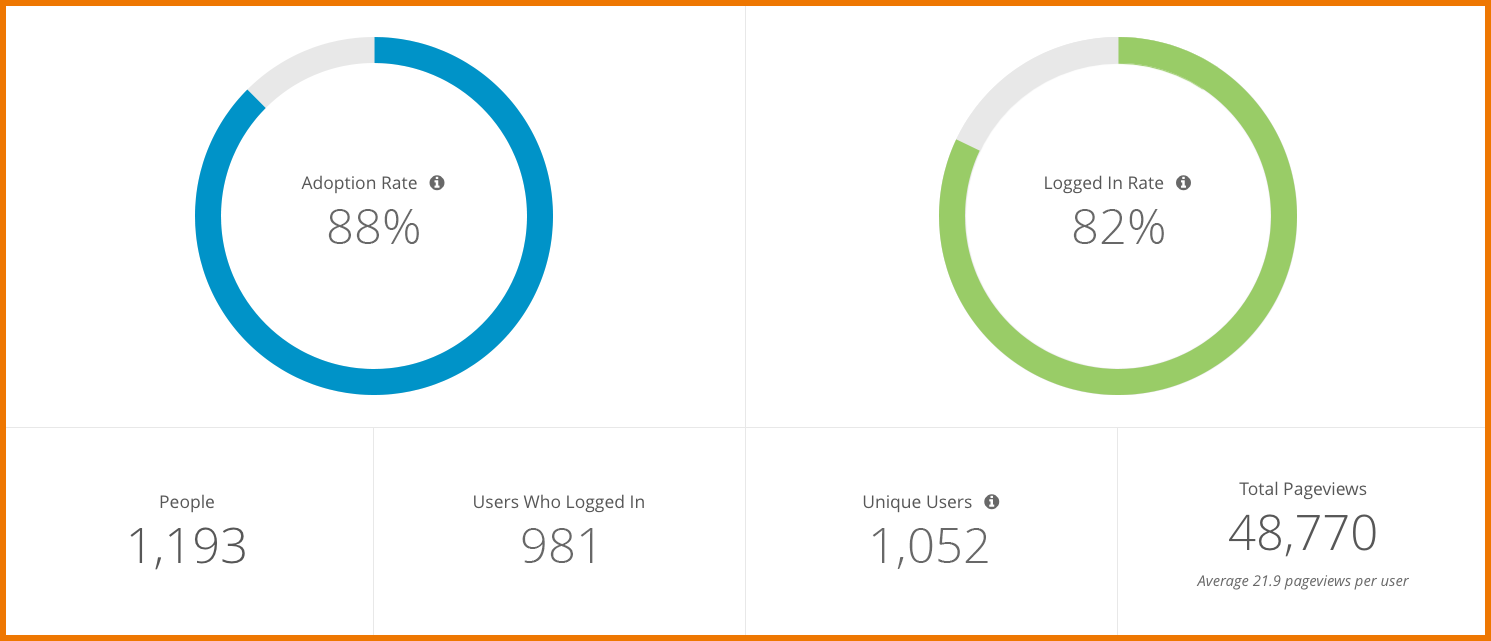
To track your virtual success, look at metrics like:
- Logged in rate
- App usage over time
- Visitors over time
- Page views for sessions
- Virtual booth views
- Session check-ins and check-outs
- Video views
- Top clicked external links
- Activity or gamification leaderboard
- Chat adoption rate, and # of messages sent
- # of group discussions and participants
- Livestream viewer hours
And psst: this can all be done using EventMobi, too!
The best part is that virtual events don’t cost as much as in-person events. No venue costs, no insurance costs—the sky’s the limit! Pay attention to attendee engagement and you’re almost guaranteed a great return on your investment.
Other event ROI metrics to pay attention to
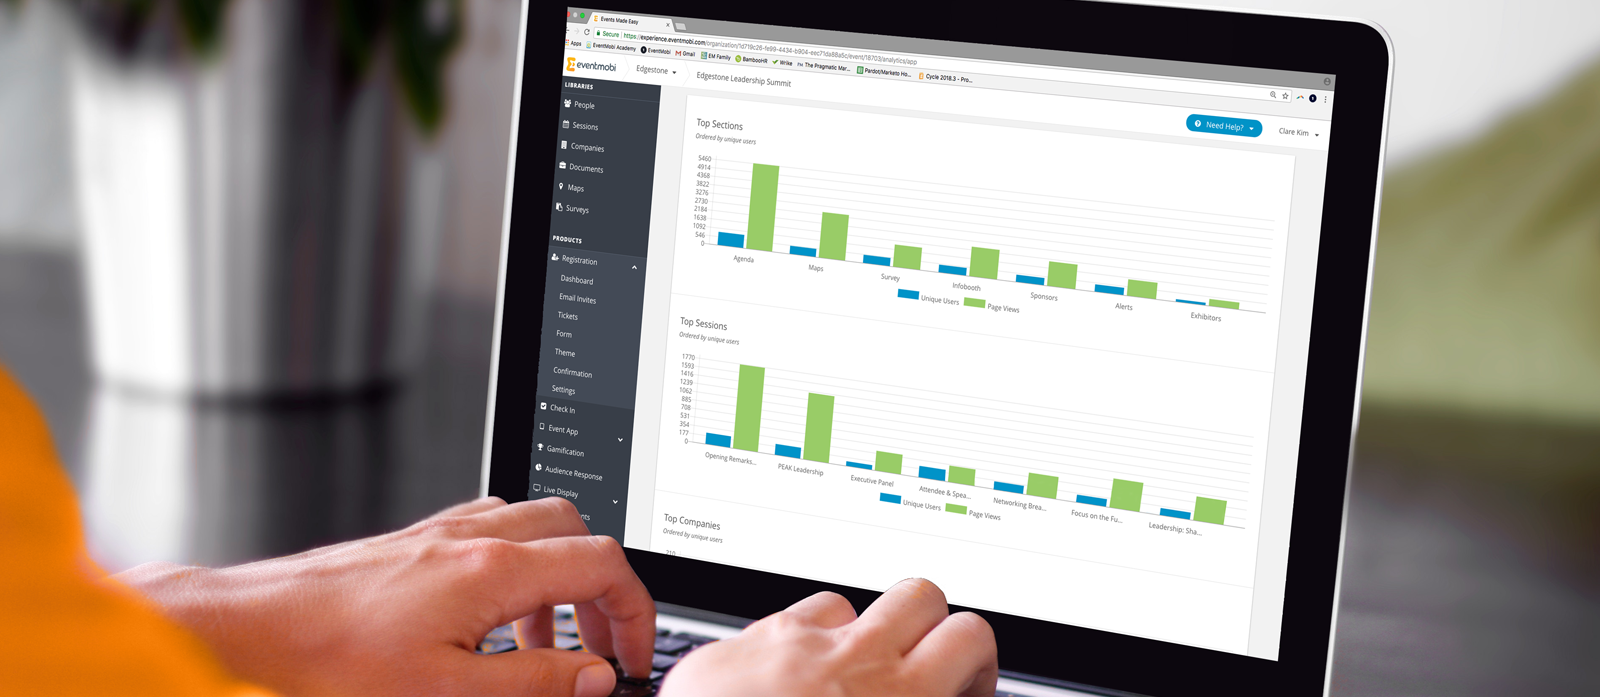
Hard data isn’t the only thing that matters when you’re looking at the value of your event. One of the best leading indicators for ROI is knowing what resonates with your audience!
- Attendees’ areas of interest. Keep track through:
- Top visited sections of your event or event app
- Popular group discussion topics
- Session attendance
- Speakers with the highest turnout
- Engagement with live polls
- Participation in event games
- Qualitative data collected through post-event surveys
- Gamification systems. These offer stats on your most popular event challenges—which act as a great window into attendee engagement. Your top players are your event champions, who are most likely to provide positive testimonials.
- Soft data. Social media shout-outs and post-event surveys are invaluable. If everyone is raving about the same session, you know it was a hit.
Recommended Resource: The best way to up the ROI on your event is to up your attendee engagement game. Explore how Gamification can help you up session views, sponsor meetings, and other key event experience metrics—and track where your event is thriving.
Bring this information to your next planning session to motivate and inspire your team!
Now what? You have all these metrics and success indicators, but what about…
Actually calculating ROI.
There are complex, finance-focused systems. We’ll let you chat with your CFO, accountant, or other financial lead about those. But when it comes to running baseline analyses, we’ve got your back.
How to Calculate Event ROI
Here’re two ways you can calculate event ROI without a finance background:
Expenses vs. revenue
A simple way to calculate event ROI is by weighing your expenses against your revenue.
Ask yourself: how much money did the event cost, and how much did it earn?
If you invested a total of $2000 into your event and earned $3000, your event ROI is $1000.
Depending on your goals, you can measure if that feels like a reasonable return on investment.
What you’ll need to do:
- Create an itemized list of expenses
- Create an itemized list of revenue
- Add up all the expenses
- Add up all the revenue
- Subtract your expenses from your revenue
- Relish in returns!
If you want to get super granular, you can also apply certain expenses against certain revenue generators for your event.
For example: how much did all your merch cost to create? And how much revenue did you make off it?
Or: how much did you spend advertising a specific speaker or session on social media? And how did attendance compare to the sessions you didn’t advertise as consistently?
Profit vs. investment
Expenses and revenue are straightforward to measure, but they don’t always account for the costs of time, energy, and labor. Tracking these investments against your overall profit gives you more data to work with.
Let’s take a look at the value of event volunteers. While they’re offering their services for free, they still provide value!
Imagine if every volunteer was being paid $15/hour. If you hold 3 hours of training for a 9 hour event, that amounts to $180 per volunteer. Now, if you had 10 volunteers, that labor is valued at $1800.
If your event only made $2000, that’s not a great return on investment for those hours of labor and organizing. But if you made $6000? Now that’s a return on investment!
How Event Tech Helps
Measuring event ROI is a whole lot easier with the help of quality event tech!
Here are a few tools that can help you capture those essential metrics:
EventMobi
One of the best ways to measure event ROI is to run your event using a system that’s already keeping track for you. EventMobi has helped with crucial conferences and events for organizations like yours for 13+ years!
Here’s how we support our event organizations:
EventMobi offers:
- An all-in-one event experience platform for in-person, virtual, and hybrid events
- Superpowered professional services that help make your event a hit
- Mobile event apps your attendees can use on the go
- Networking tools for your attendees and sponsors
- Personalized agendas
- Real time tracking of attendee interest, engagement, and action
- Advanced analytics that calculate reports from a single dashboard
- Exhibitor and sponsor lead capture
- Event X365: a year-round networking and community platform for when your event is over
Book a demo today, and we’ll help you craft your next smash event.
Social & brand awareness
If you want to measure your event marketing success, tap into tech that helps you thrive across social media.
Whether that’s raising visibility, saving on tasking time, or running reports, knowing (and expanding!) your reach will absolutely boost your return on investment.
Here are a few simple tools to get you started:
Marketing tools
Event marketing ROI can sometimes feel difficult to measure. But with the right tools, you can actively track how much mileage your marketing efforts are getting!
We recommend tapping into these three event tools:
CRMs
Your event ROI goes beyond the day of the event itself!
Keep up relationships with your attendees using customer relationship management (CRM) software like:
Analytics
Data’s not much use if you don’t really explore what it has to offer! Reporting is your friend, and can set you up for success in future events.
Run some event ROI analysis with reports from these great tools:
7 Simple Steps to Measuring Event ROI
Now that you know what event ROI is, which metrics to track, and how to calculate it, let’s explore 7 simple steps to measuring your success:
1) Identify stakeholders
Before your event kicks off, you want to identify and connect with your stakeholders. Think about everyone who will be investing time, energy, and money into your event!
This could include your:
- Marketing manager
- Sponsor lead
- Financial team
- Volunteer coordinator
- Board of directors
- Returning sponsors
These folks give you key insights about what initial investment (and possible return!) could look like. For example, once you know what sponsors potentially have to offer, you can adjust your budget accordingly.
2) Get them invested in ROI
Big ideas often come with initial investments of money and labor. When you ask your team to commit to that investment, highlight how much your organization will benefit. Turn team members into cheerleaders for the future, and you might be surprised by the creative solutions they offer!
Plus, measuring event ROI should ultimately make everyone’s jobs, and lives, easier. Make that clear, and empower your team to own their results.
3) Set your SMART goals
Like we said: you’re the person who determines what good event ROI looks like. Set SMART Goals that clearly define the event ROI metrics you’re targeting.
This could include bringing in:
- A specific number of leads
- A target amount of revenue
- A total number of registrations
- Or more!
You can only calculate your ROI if you know both what you’re investing and what you stand to gain. Make your ambitions possible!
4) Build a budget
Ah, the event budget! While it’s fun to imagine a limitless supply of money to hold the bash of your dreams, your financial team might have something else to say about it.
Budget out the maximum amount you’re willing to invest in your event, along with the amount you anticipate you’ll earn. Be sure to include a section for your actuals—at the end of the event, you’ll be able to see how close your estimates were to reality!
5) Start measuring data
Measuring event ROI is all about bringing in the data. With the numbers at hand, you can actually track how your event is turning out.
Some important data to track includes:
- Expenses (venue, speaker fees, marketing costs, etc.)
- Volunteer hours
- Sponsorships
- Registrations (vs. actual attendees!)
- Marketing metrics
Pay special attention to the data that specifically ties back to your SMART Goals!
6) Measure your actuals
Don’t wait until after the event to start crunching those numbers: measure ROI as you go.
Wondering how? Track how many registrations you’re getting against the dollars or hours you’re spending. See how your messaging is driving social engagement or event sign-ups. You can even keep tabs on how often sessions are being added to personal agendas.
This will put the power in your hands to turn on a dime and adapt to your situation, making the most of your budget. A budget isn’t a reality: it’s a guess. The real thing is what matters most.
7) Check out your results
Event ROI analysis is what turns this event’s data into your next event’s game plan. Measure those actuals against your original predictions. Where did you knock things out of the park? Where did you struggle unexpectedly?
And if you’re nailing it? That’s great information to share with your sponsors and board, letting them know that what you’re doing is working.
If it’s not, at least you know where things went wrong. And that means you can find solutions for next time.
Bonus: Collect qualitative results
Post-event surveys bring your attendee data beyond the numbers! Read up on what people can’t stop talking about, and collect consistent feedback on what could change.
Be sure to connect with your exhibitors and sponsors as well. Based on your attendee and exhibitor analytics, you can tailor your content and sponsorship packages to build stronger connections in the future.
How to Create an Event ROI Report
Now that you understand what metrics to focus on, how do you take this data and put it into a formal event ROI report?
The key is to pull your metrics together and organize them to tell a story of your event:
- What were your goals and intentions?
- What actually happened, according to the data?
- What have you learned for next time?
The final product can take any form you choose—whether you prefer a nice Word document, a slide deck, or a video report. Here’s an example event ROI report structure you might consider:
- Goals & KPIs: Review what your goals and intentions were for your event. Was your goal revenue? Brand recognition? Community building? The rest of your report should be centered around these initial goals.
- Revenue Report: Show what your initial event budget was, and compare that to what was actually earned and spent. Highlight any areas where you underestimated the budget you’d need, and look for places where you brought in unexpected revenue.
- Attendee Engagement: Gather all of your data about audience engagement! This includes:
- event app adoption rates
- session attendance
- gamification participation
- social shares
Highlight which aspects of your event sparked the most engagement, and what fell flat.
- Feedback Review: Share the human feedback behind the numbers. Pull a few quotes from your post-event surveys that give the best insights into how people responded to your event. Look for patterns in the words and phrases people use to describe your event, and note if people are making the same suggestions over and over.
- Planning For The Future: Round off with a summary of the report and explain how you can apply the lessons you learned for your next event.
How to Improve Event ROI for the Future
The best part of running events is knowing that there’s always another one in the future! Measuring event ROI is just a starting point, and helps you set goals for next time.
Looking for a surefire way to improve event ROI moving forward? 📈 Book your free demo with EventMobi to see everything we have to offer for your next event